
The burndown chart, in French follow the combustion, is a way to follow the progress of the work done.
Although it can be applied to any environment and any type of project, the burndown chart is a progress tool mainly used within the framework of the agile Scrum method.
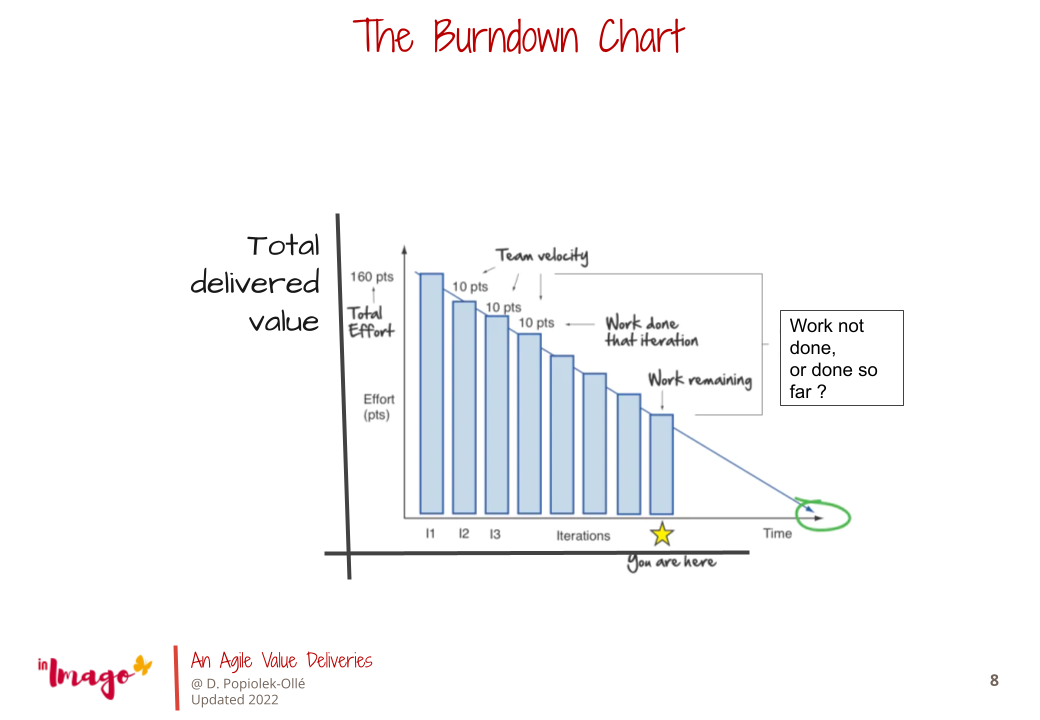
It has two axes:
- the time needed to complete a project (estimated number of days or hours required) on the horizontal axis;
- the work left to be done (sum of estimated durations of all tasks, or total user stories translated into points) on the vertical axis.
The estimate can be made on the basis of “planning poker ®” or sometimes also “Scrum Poker”.
This technique was created in 2002 by James Grenning then popularized by Mike Cohn in his book Agile estimating and planning. Both James and Mike were contributors to the Agile manifesto.
The burndown chart
In Scrum, there are two types of burndown chart:
- iteration burndown (or sprint), where the unit of time used is often the day, since an iteration, or development cycle, usually lasts 2 to 4 weeks;
- release burndown (relating to the delivery of a version), where the unit is the sprint, the project being composed of several development cycles whose total duration covers several months.
How to create a burndown chart in 4 steps
1. Define the goal
The first step in creating a progress chart is to identify a goal you want to achieve and project the actions that will be necessary to ensure its achievement.
2. Divide the project into results to be obtained and assess their workload
The sprint objective allows you to identify the key actions to be carried out as a priority, as well as their dependencies, to obtain a convincing result at the end of the sprint. These actions are often divided into a set of tasks deemed necessary. Note: making an appointment is not a task to be taken into account. It is the result we expect from the appointment that is the useful action to take into account in the estimate.
3. Prepare the graph
It’s time to create the burndown chart. This means representing information from a two-axis graph:
- horizontal, indicating time (days, hours, iterations, etc.),
- vertical, indicating the effort (story points).
Since this is tracking the progress of work and what remains to be done, the starting point is obviously not zero but the top of the graph, the goal being to reach 0 at the end with a downward curve.
If we take the example provided above, the execution effort is estimated at 160 points, so the top of the vertical axis indicates this starting point of 160.
4. Complete and analyze the graph
Every day, during the daily scrum, the number of tasks remaining to be carried out is reviewed and updated.
You will populate your tool with this information as you go. If you use Excel, you fill in a table that allows you to generate a graph.
To view actual versus ideal progress:
- start by drawing the ideal evolution line from the top of the vertical axis to the end of the horizontal axis;
- compare with the actual progress curve in another color.
☝️ Typically, at the start of the project or a development cycle, the curve representing actual progress is above the ideal line, as the project team needs time to be 100% operational.
But the delay is often caught up on the second half of the graph with an acceleration of the completion of tasks, the team being more and more efficient.
Burndown Chart : Excel
First, to create your burndown chart in Excel, or any other tool, make sure that:
- The amount of work and time allocated are consistent. The set of tasks must not be disproportionate to the execution time. Otherwise, it will be impossible to make a realistic estimate of the delay.
- The backlog, or amount of work left to do, is reviewed every sprint based on the work done. For this, the remaining work is updated daily according to the degree of completion or the delay in the execution of the tasks.
The tools at your disposal
Planning Poker
Planning Poker was created in 2002 by James Grenning and then popularized by Mike Cohn. Planning poker is an estimation technique (in Story Points or Ideal Days) used in Agile, Scrum and SAFe organizations. This estimation method is also called “Scrum Poker“.
 Tools 1- Support change – criteria for success To face the strategic challenges of the company, the leader will have to bring together the elements of success: 1- Vision is …
  Strategic management aligns operational and market know-how to ensure the sustainability of the company. To function, strategic management is based on 3 dimensions: 1-The management of the organization as a …
  Strategic management always looked for decision-making tools to facilitate its decision-making. Capturing the data to make the right decision is strategic. Today data is key in strategic management. Integrating your …
 Continue reading “Digital tools for effective strategic management”